
Introduction
The next few articles will cover the power play and penalty kill. Although a substantial amount of work has been done on even-strength play, very little attention has been paid to the importance of special teams. I hope we can learn about the influence special teams has on winning and it’s %regression to the mean, starting with opportunities and time today.
With any stat the 2 most important things to consider are a) Is it repeatable? That is to say, does it have a high correlation with itself, or put a third way, shows modest regression to the mean? And secondly, b) does it correlate with (out of sample) winning? Repeatable stats can be relied upon to give us good information that is skill driven, and not heavily influenced by “luck.” And ultimately tell us something about teams that win.[1]
Methods
I gathered data from 2009-2012 NHL PBP and game summaries on minor penalties. These were sent to excel where I performed randomization of games, and the generation of models. For specifics see appendix below.
Results
Let’s start with Table 1. The basic statistics behind the metrics were interested in.
OPP: Power-Play Opportunities per team per game. %SD: Standard Deviation. Var: Variance. N: Number of games in the sample.
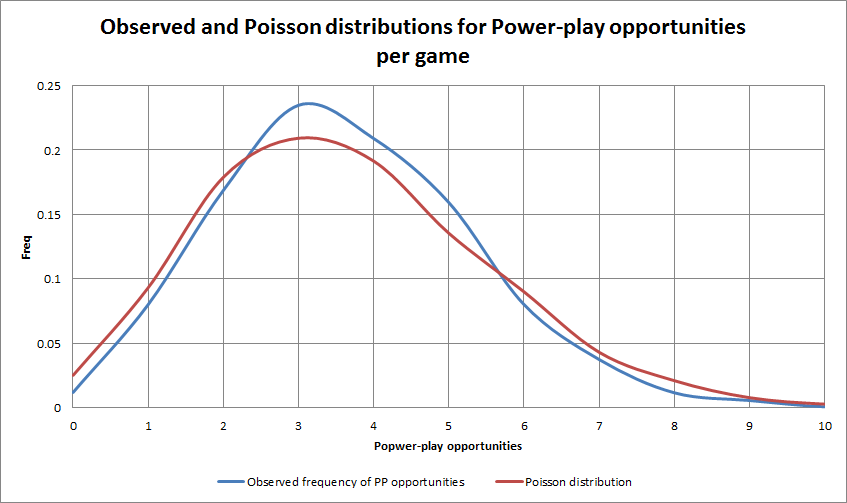
Figure 1. Graph above in blue shows the distribution of Power-play opportunities per game (for 1 team) in the sample. The red distribution is the Poisson distribution assuming a lambda equal to the mean PP-Opp in our sample.
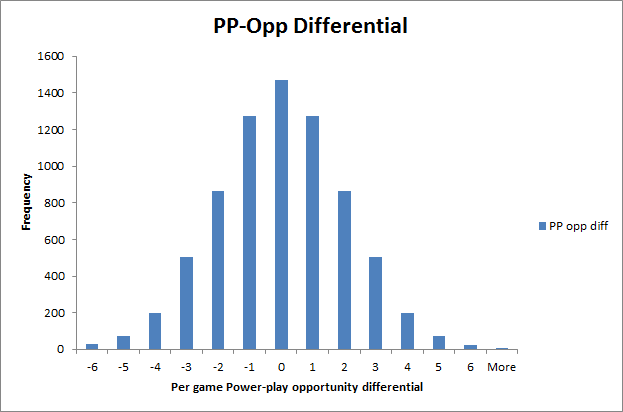
Figure 2. Histogram above shows the distribution of PP-Opp differential. The frequency with which a team would have an extra power-play of penalty kill. SD = 2.04
Self(Opp): auto-correlation of power-play opportunities, Pts(Opp): correlation of power-play opportunities to team points, Self(Time): auto-correlation of power-play time, Pts(Time): correlation of power-play time to team points, Self(Opp): auto-correlation of power-play opportunities differetial, Pts(Opp): correlation of power-play opportunities diferential to team points, Self(Opp): auto-correlation of power-play time differential, Pts(Opp): correlation of power-play time differential to team points.
At first glance it certainly appears strange. While opportunities are repeatable they’re almost meaningless. The correlation between opportunities and team points is essentially 0. What’s important to remember is that minor penalties are heavily influenced by score effects, and it seems to stem from referee bias.
Mean(Opp%): Average proportion of power-play opportunities earned by a team, subdivided above by score. SD: Standard deviation. Table 2 above shows that trailing teams will generate more power-plays than leading teams by a significant amount.
To account for this we must create a model that accounts for score effects. The easy way is to only use score tied (or perhaps score close, but unlikely as this isn’t a team effect, but a referee effect). By only using score tied we lose a lot of ice time played when the score isn’t tied. We can attempt to adjust for score effects using a linear regression model.
Self(): auto-correlation of 41 games, Pts(): correlation to out of sample team points.
By accounting for score effects, we can estimate the true correlations of the opportunity differential to itself and to team points. Displayed are 2 models, one of score tied and one of score adjusted. The score-adjusted modestly outperforms the score tied model in auto-correlation (38% probability that these results were observed by chance).
After adjusting for score effects the biggest thing that jumps out is the correlation to team points. We see a drastic improvement. Our self() or “regression to the mean” drops as we’ve eliminated our bias towards looking at teams that are consistently trailing or leading.
Discussion
Clearly after adjusting for score effects we’ve arrived at a valuable stat that should be accounted for in a model that attempts to predict future team points. While not nearly as robust as EV fenwick% (r[self] and r[pts]apprx 0.5), we’ve arrived at a stat that is somewhat reliable, and predictive of future wins. Although we won’t know the absolute impact PP-Opp% has on wins until a multivariate regression is performed, it’s already been suggested that it is a skill independent of merely possessing the puck.
If anything, this validates the Canucks’ “Jerk-Puck” system to goad other teams into more minor penalties. Teams benefit from additional opportunities independent of their skill on the power-play.
Summary points
- They’re an average of 7 minor penalties a game. Good teams tend to get 2 or greater opportunities (roughly equal to 16%) more than their opponents per game.
- Opportunity differential (PP-PK) and opportunity percentage (Opp%) are heavily influenced by score effects, which seems to be mainly due to referee bias.
- After adjusting for these effects, opportunity% (ie. Proportion of total minor penalties earned) regresses to the mean by 70% over half a season, and is correlated with future team points. Thus opportunity% should be accounted for in a model that predicts future team points.
Notes
[1] When statisticians use the term “luck” it’s not what most people think. Luck in this sense is population driven. For example all goaltenders in the NHL are really good, but when we analyze what percent of their Sv% is determined by skill its really low. That’s because there is not much variance in skill between goaltenders. They all perform very well at stopping routine shots, and probably to some degree, perform very similarly on difficult shots. The variance in skill is so low that we expect things outside of their control to drive the majority of their save percentage. This other stuff is put into an basket we call “luck.”
Appendix
Model construction
The dataset was constructed from NHL PBP and game summary RTSS feeds, 2007-2012. Only minor penalties were included in the study.
I first generated models of auto-regression for discrete samples of random games. I randomized the sequence of games for each team. For each team (N=30 teams x 5 years = 150) in the data set, 2 values were generated.
The first value is the variable on interest for that sample of games (ie. 1, 10, 20, 40), and the second is the same variable for the remaining games in that randomized season (ie. out of sample). My choice to analyze the data with the second value as “games remaining” instead of another random set of equal number of games revolves around the idea of what we are trying to predict. I used these 2 arrays to generate a correlation. I then ran these models 100 times (to account for the randomization) and took the mean for each value.The same process was repeated, using team points as the second variable, again out of sample data.
For the score-adjusted model each team-game opportunity% was split into 5 variables, down2, down1, tied, up1, up2), which were used in the model.
 As many of you know, Fear the Fin is an independent site run by Sharks fans for Sharks fans. Help keep Fear the Fin independent by contributing to our